Since we are setting up analysis by dimensions in the Business Central system let us first start by understanding Dimensions in brief. Dimensions are tags that can be assigned on transactions and documents which get stored with posted transactions. Dimensions and Dimension Values are user-defined based on a specific organization’s reporting requirements.

Now Let’s see how one can set up an analysis view:
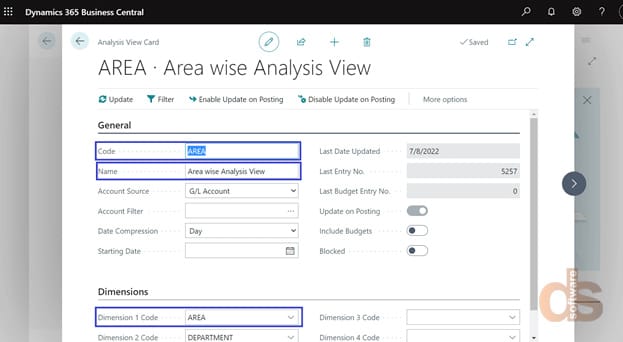
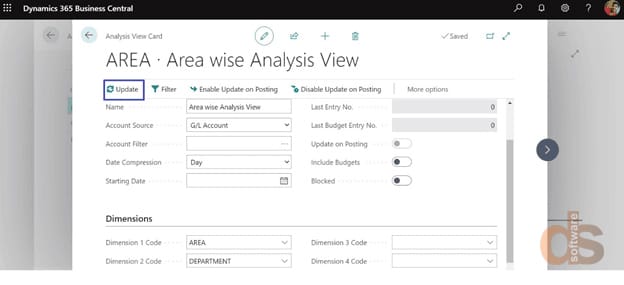
For this scenario let’s say we would like to analysis view of transactions based on Area Dimension.
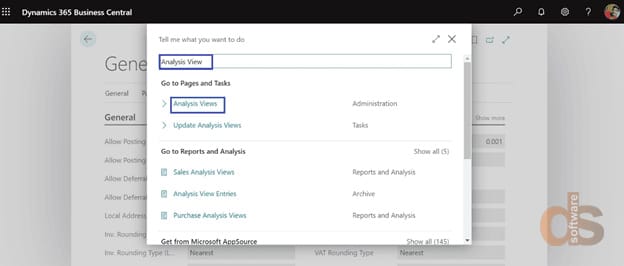
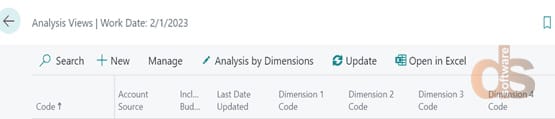
- In the global search function enter the analysis view and select Analysis View under Administration
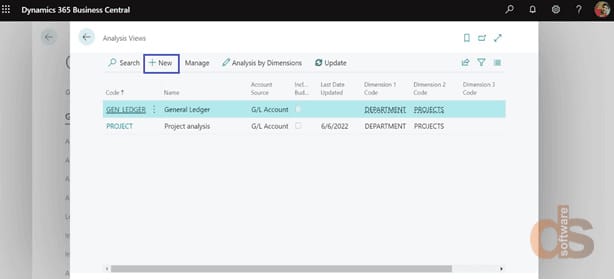
- On the Analysis View List page, choose the New action.
- In the new Analysis View Card fill in all the fields as required.
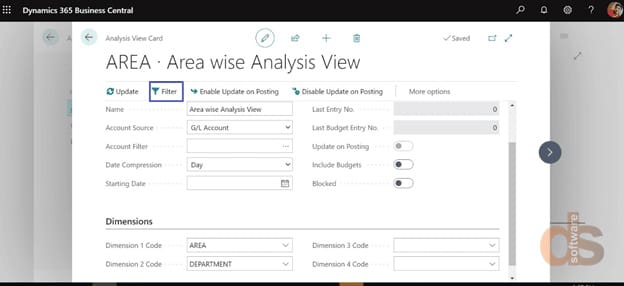
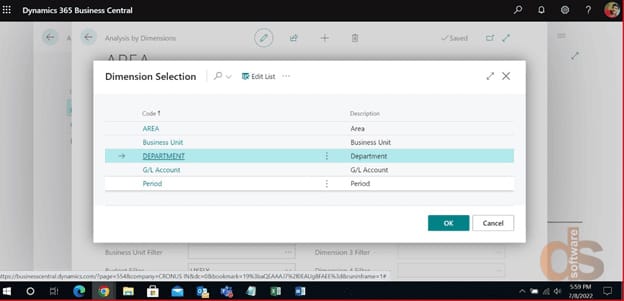
- Additional Dimensions and Dimension value filters can be specified in the filter tab on the ribbon.
Note: We can set up an analysis view for a combination of up to four dimensions. For other combinations, we can create a new one if required.
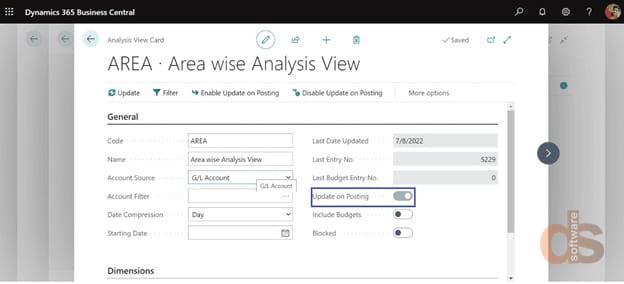
- For updating an Analysis View, select the update function.
Once updated analysis view card’s last updated date field gets updated with today’s date:

Note: We can also enable updates on posting if we do not wish to update the analysis view each time we run the analysis view. This is however not recommended for organizations that are processing a high volume of data. In such cases, one needs to update Analysis View each time before using the analysis view.
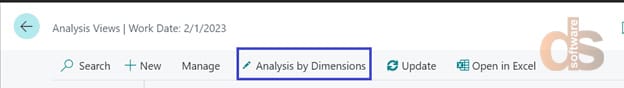
- Once the Analysis view card has been set up we need to go back to the Analysis View list page, select an analysis view code on which we wish to work on, and click on Analysis by Dimension.
- Now provide all the necessary filters in the Analysis by Dimension card such as date range, GL account filter, and then define how you would like to see the columns as.
We can select columns to show data by period or based on dimension values of the dimensions specified on the dimension card.
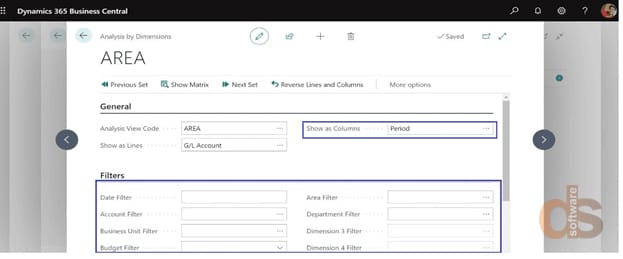
- We can select columns to show data by period or based on dimension values of the dimensions specified on the Analysis View card.
- We can also specify if columns should show data by day, week month quarter, or annual or Accounting Period for this we can select an appropriate option under the matrix options fast tab.
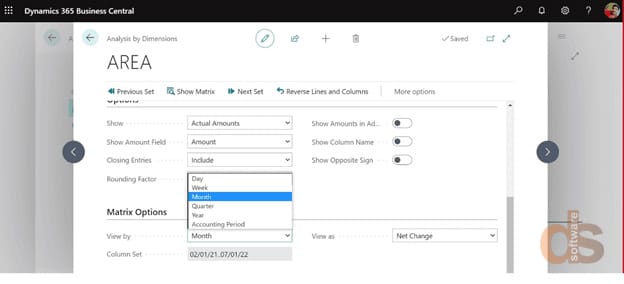
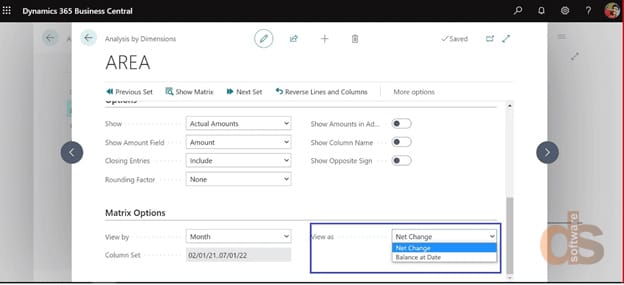
- Under the matrix option, we can also specify if we wish to view the data as net change or as balance as on date.
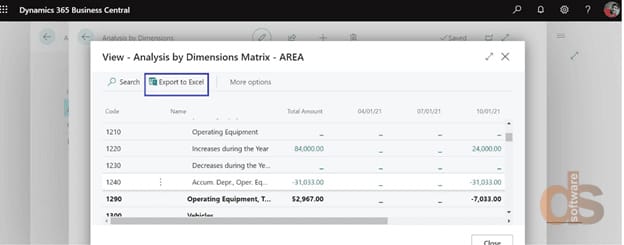
- Once all the above fields have been updated we can go ahead and click on Show matrix to see the analysis by dimension. If users like they can also export this to excel.
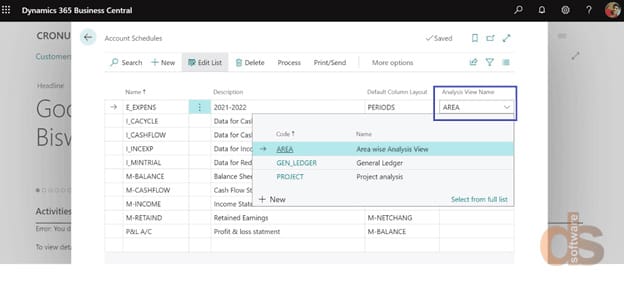
- One can also attach an analysis view to accounts schedules to facilitate filtering transactions in accounts schedules based on dimensions.
About the author:
Biswadev Banerjee
Biswadev Banerjee is working as a Microsoft NAV / Dynamics 365 Business Central Functional Consultant at Direction Software LLP.